Hi,
one of my Blog readers ask me this: “Hello, could you please advice…you all seem to be very experienced with MS. ‘m interested in resource management. I tried to apply MSP and found that I’m not able to see an impact on resources if I make changes in some project tasks. Some tasks are dependent and are shifted with modification of others. But, I need to go to another page to see who becomes overloaded and I would prefer to have the view on resource occupation on the page of Gantt. Is it possible? Thank you so much !! “
In MS PROJECT 2010, MS PROJECT 2013 Gant Chart is Task Related. I’ll make over allocation by purpose to show you what you can do.
First let me put some Tasks:
and some Resources:
Finally I will assign Resources to the Tasks:
On the First column you can see a “burning man”, which means that some of the resources are over allocated.
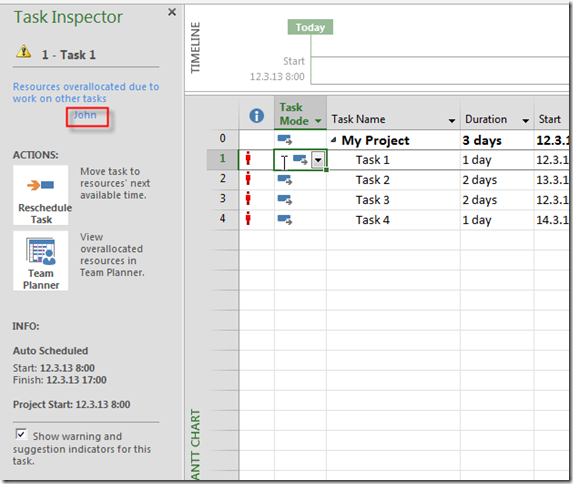
But here you CAN NOT see which resource is over allocated if you do not use The Task Inspector.
To do so, right click on the Burning man, and you will get:
and you will get:
But there is one place with much better View of over allocation – the Team Planner (available only in MS PROJECT PROFESSIONAL 2013, not in Standard version):
Here you can see who is over allocated, when, and on which Tasks!
You can use Resource Usage View as well:
Here you can see who is over allocated, on which tasks and how much!
The same thing is with Task Usage View:
This View shows Task, and Recourses assigned to each Task, and over allocation as well.
But if you still want to see Gant, and Over allocated Recourses, you can do this:
then:
and:
and finally:
Easy, isn’t it!
Bye!


Hello Nenad, I really liked your post and am inspired in creating my own blog. OK if I link to your blog? and will definately name you as the person that gets credit for the solution 🙂
I don’t mind.
Hi Nenad,
Thank you for your informative post on resource allocation. I’m working in MS Project 2010, and my problem is that MS Project overallocates my resources. I’ve set my resources up so they each have a set number of hours they are available each day – let’s assume 8 hours. The program works fine when I assign “task 1” to a person. For instance, a 40-hour task would be scheduled over 5 days – let’s say from March 1 through 4.
The problem is when I have a “task 2” for this resource, that could be started on March 1, but could also start later. Let’s assume task 2 is also 40 hours. MS Project schedules task 2 to also begin on March 1, and last 8 hours each day. Then I have an overallocation, and I have to fix it manually.
It seems like MS Project should be “smarter” than this – do you have any advice?
Thanks,
Sara del Moral (Washington State Auditor’s Office, United States)
Hi Sara,
sorry but I have to dissapoint you. If you schedule two Tasks at the Same time (in your example, March 1), and you put same person with same amount of work (for example 100%, or 8 hours per day), that Person will be (and should be) overallocated, because MS PROJECT doesn’t know (how could it?) that you second task MIGHT start latter. If it should start latter, you can put constraint, start no earlier than, for example, March 8th, and that will solve your problem.
If you had something different on your mind, do not hesitate to give me a notice, and I’ll be glad to help you
Regards,
Nenad
I’m having the same problem. I have a number of tasks that can be started at the same time. I only have one worker doing these tasks. I don’t want to set a predecessor to these tasks because they can all be completed in any order. Is there a way I can let MS project know that I want each of these task to take the time needed to be completed?
I made a small project
construction, setting up 10 ml of sidewalk.
I just spent force , only mans, normal working 8 hours a day. from 8 to 16.30 with 30 min lunch break
With all this where we put two people in the team and I respect the idea of putting 200%, turned red, Over alocation instant
In reality, the two men are working 8 hours normal activity, ther
what to do???
if you increase the payment per hour and keep 100% time, when interpreting the chart must keep in mind that there actually have 2 people
opinions?
idea
where wrong
with respect Dan, Oradea, Romania
How do I attach my little project???
to be able to see your
to have your opinions???
How????
To be honest, I did not understand your problem. Can you give me a little bit more description, and send me an mpp file!
What would be the best way to print this layout? It’s ridiculously hard to present the over allocated resources. The whole graph system seems very rigid and best used while in front of the computer.
Fitting 4 months of graph into one page and reading the time line seems impossible. I don’t have the professional edition, but printing an overview of the tasks that are overallocated and showing how they are related to one another (color codes for instance?) makes my day at the office pretty hard.
You can use one of the built in Reports (use Report Tab)Ž, or you can create your own report. That’s best you can do with MS PROJECT